ACNET
The Accelerator Control NETwork is a system of computers that monitors and controls the accelerator complex. It is interfaced to users through consoles in the MCR and elsewhere.
CONSOLE
A standard set of screens and other devices used by an operator or systems specialist to control and monitor devices in the accelerator complex.
The Basics
ACNET should be running on the FTBFLX04 and FTBFLX05 Linux computers in the MTest Control Room. There are 3 main types of pages:
P… pages are most often used, and are for controlling programs and parameters. They default to an index page when not in use.
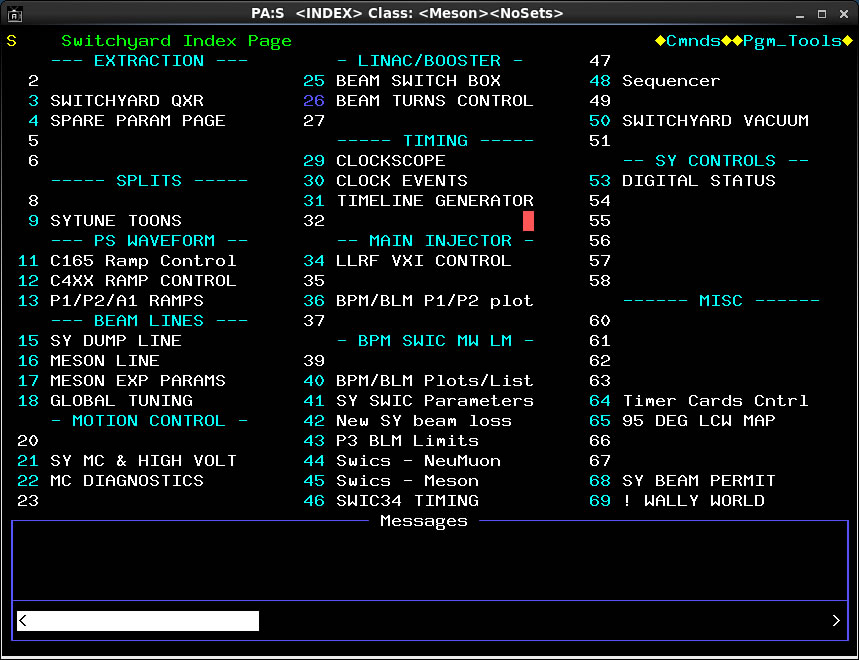
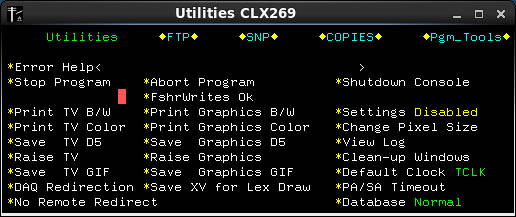
The Utilities page is a small screen which comes up when the console is started.
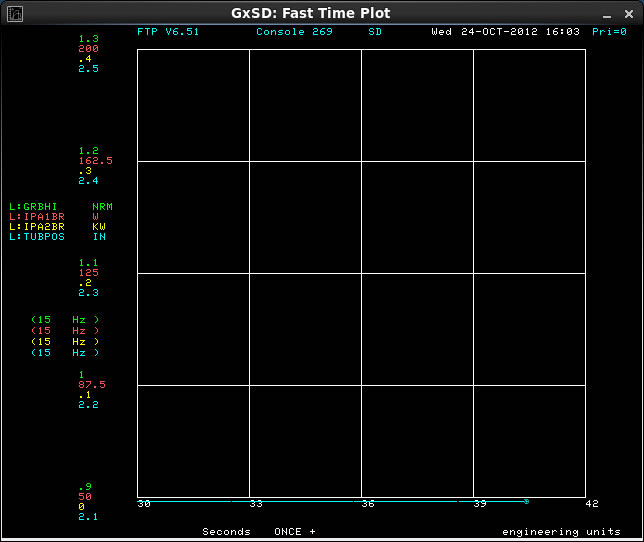
GxS… pages are used for displaying plots or other Graphics

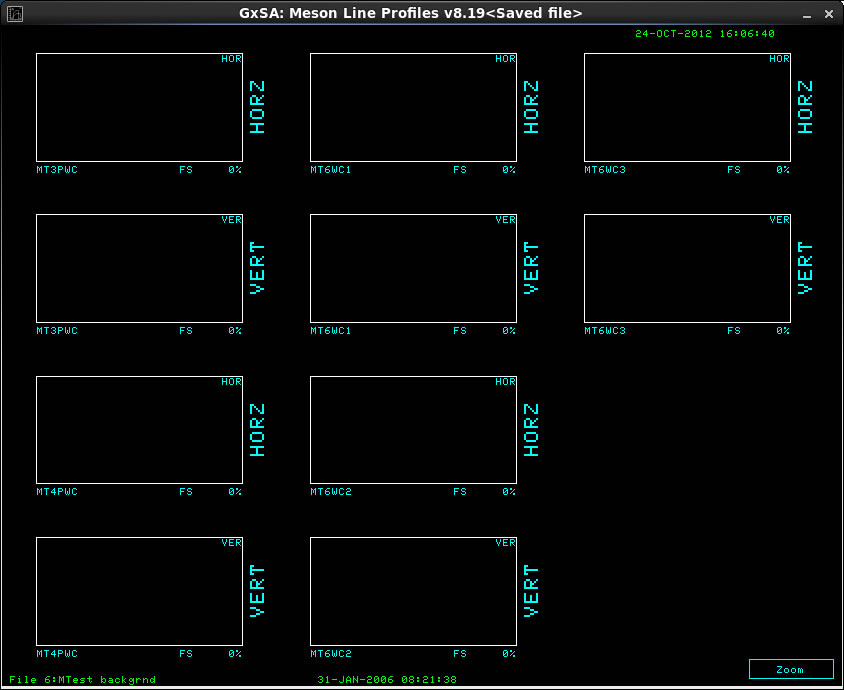
Beam Profiles
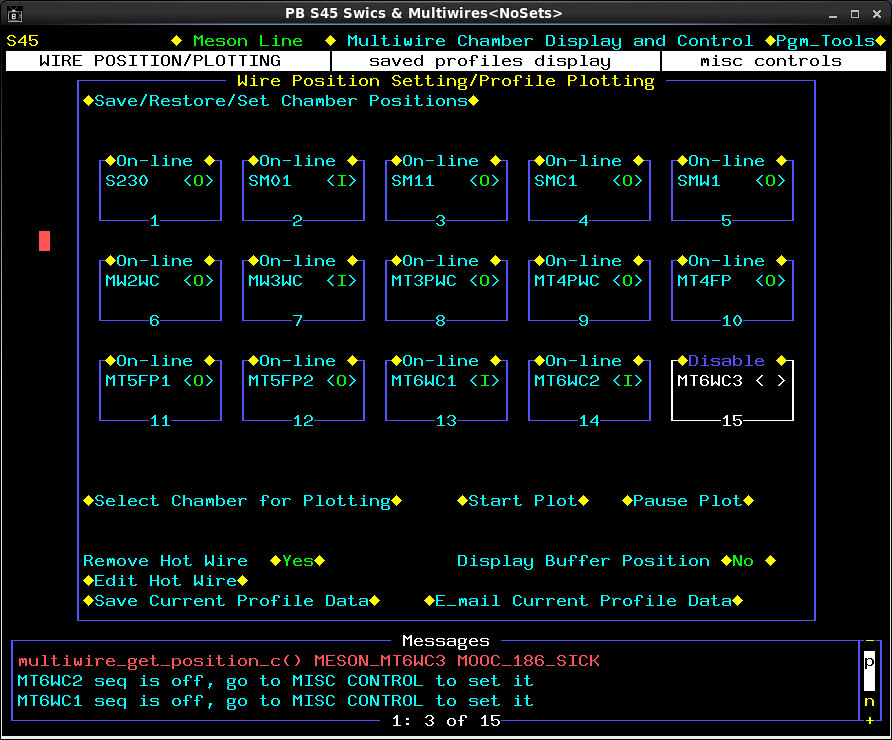
- If the S45 screen is not up, put the mouse in the extreme upper left corner and type S45, then hit ENTER.
- If the MESON page is not selected, then go to the drop down menus across the top of the page and select ‘MESON’ from the first one.
- A list of meson PWCs will appear on the screen. Click on the names of any you wish to see. There are 3 MT6 pwcs. An asterisk will appear next to the names of the selected planes. Choose MT6WC1, MT6WC2, and MT6WC3 to see the beam profiles.
- Click on the ‘Start Plot’ command.
- Choose the ‘Plot’ command. A list of the default options will appear. Change any that are not as follows:
- Continuous
- Relative to center (Absolute)
- Both Planes
- Autoscale (Positive)
- SA_slot [This can be any one of the GxSA, GxSB, GxSC, etc. screens]
- Hardware Fit
Parameters
Description of Parameters.
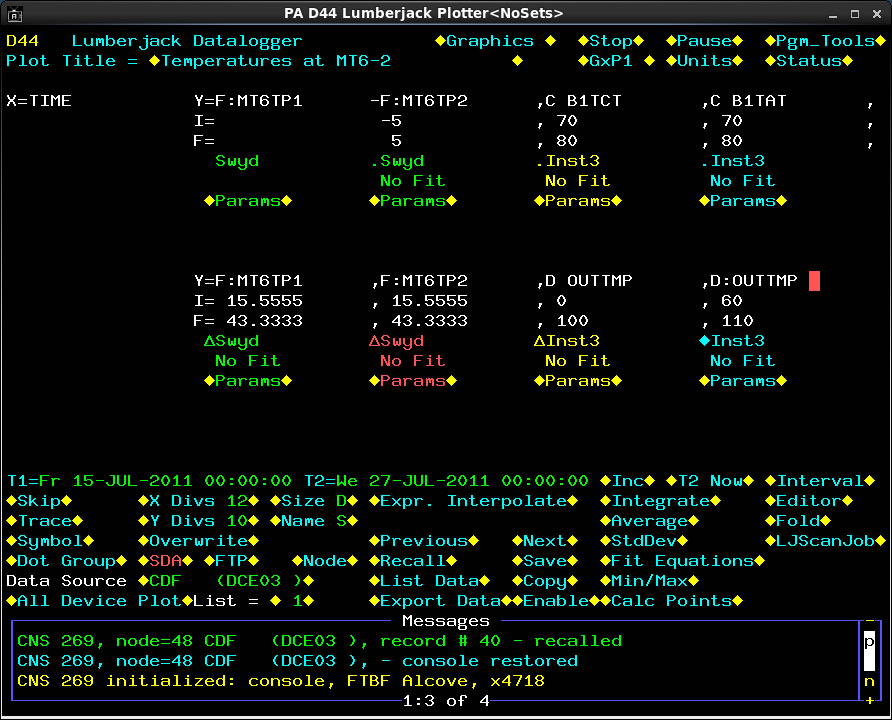
Plotting
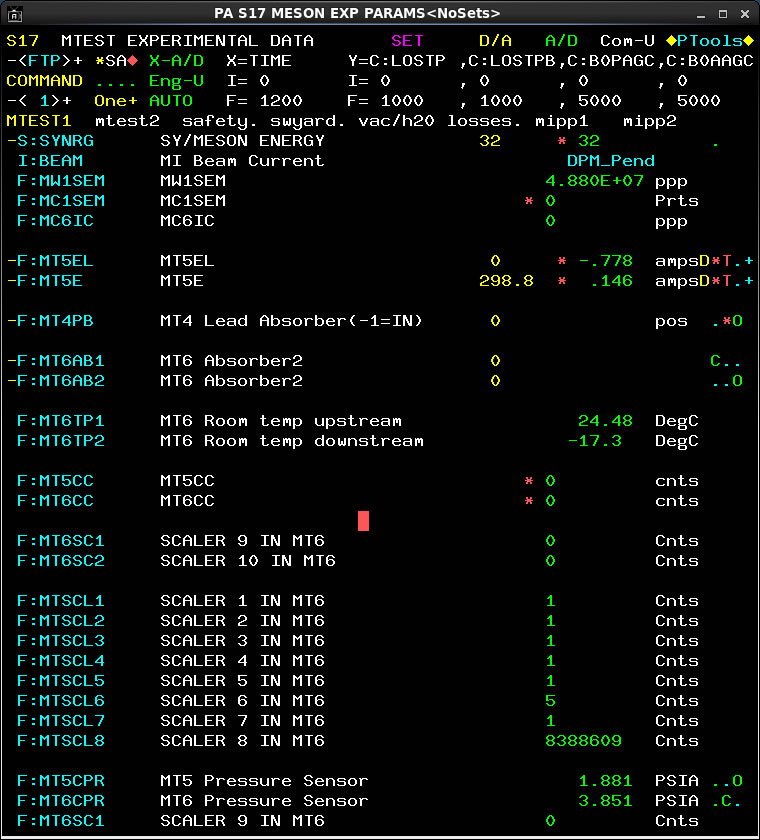
How to plot a variable (say F:MT6TP1) from D44
- Go to a variable, often shown by the first white line (e.g. Y=A:IBEAM) and change that to Y=F:MT6TP1
- Change the ranges to suitable numbers e.g. I=20 and F=40
- Go to the 3rd line (it is often colored) which says .RunCo or .E_760 or .CDF etc. and click here. Change the option to “Swyd 1 min” or “FixTr Event”. The second column here specifies the interval at which the data was recorded. So “Event” means that MT6TP1 was recorded for every event of the MI clock.
- For selecting the date and time ranges, please change T1 and T2. Click or interrupt after entering the desired values, ensure that T1 and T2 values show up in green.
- To select only one variable for drawing, you will have to deselect all of the others. This is done by inserting a space anywhere in the names of each of these variables. For e.g. Y=M:TRGTD becomes Y= :TRGTD, if you do not want to plot it along with MT6TP1. Do this for each of the variables on the D44 page, if they are not going to be plotted.
- To plot the MT6TP1, click on the white lines (or blank space) within the information window on MT6TP1. So these could be the ranges I= or F= . The plot shows up in a new window !
How to fit a variable
- Go to “No Fit” which is the fifth line down in the info window.
- Click on “None” inside “Fit Function”. Select Poly or Exp Poly.
- Select the order of the polynomial inside “Polynom order”. E.g 1 or 2.
- Click on “Return” to close the window.
- Click on the white lines inside the information window of MT6TP1 to obtain the plot.
- For changing the plot options : Go to “Params” in the information window.
- You can change the Trace/Connection or Symbol Type, to suit your needs.