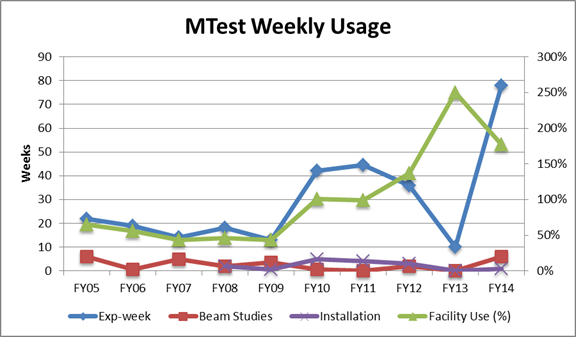
The Green Line (Facility Use) is a percentage which includes the number of weeks the facility was being used for data taking by an experiment, and installation of an experiment (some large experiments need several days without beam to install) and beam used for facility tests or outreach. This total is then normalized to the total number of weeks the beam was available, (less than 52).
The Blue Line (Exp-week) is the total number of weeks the beamline was used by one experiment to take data.
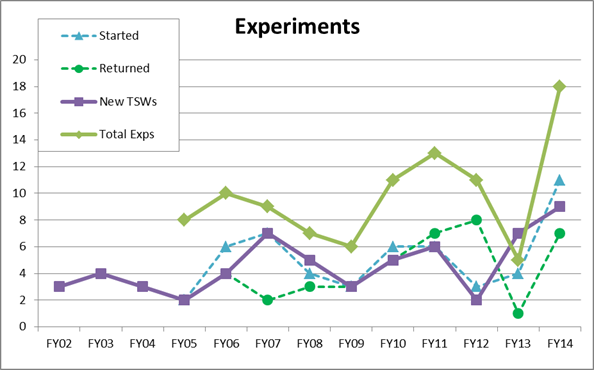
Every experiment is required to write a TSW before they are allowed to take beam. This process is usually completed months ahead of time. While an experiment may not necessarily start taking beam the same year their TSW is approved, the number of TSWs approved a year, is a good indication of how many new experiments are joining the FTBF community.
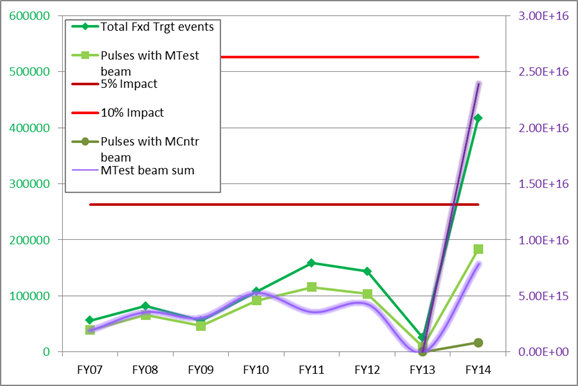
Although the amount of beam sent to FTBF is shown in pink, it is not a very useful number as experiments will often request less than highest intensity beam to test their devices.
Until 2012, the Director’s guideline for test beam users effect on anti-proton production and neutrino beams is 5%, this usually results in one 6-second event in the 60-second timeline for 12 hours a day. The graph shows the number of test beam pulses (with and without beam) which have occurred with respect to the 5% limit.
In 2012, the SeaQuest Experiment started running which was allowed a 10% impact on neutrino beam. One 6-second event /60 seconds for 24 hours a day. Test beam user effects became transparent. Also, due to the ANUShutdown, there were only 7 months of beam available in 2012, and 1 month in 2013, so the number of pulses adding up to 5% fell dramatically.
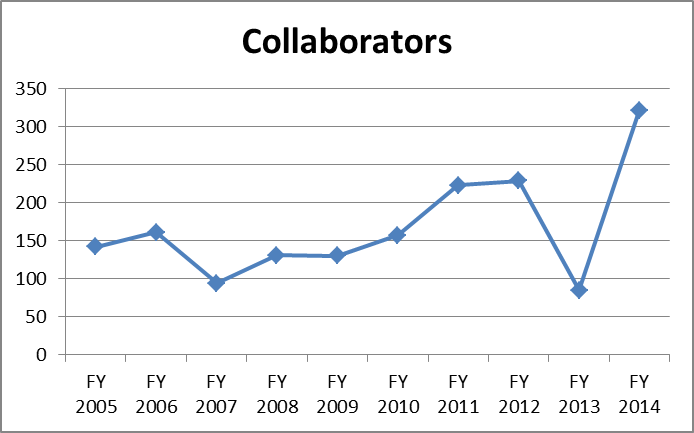
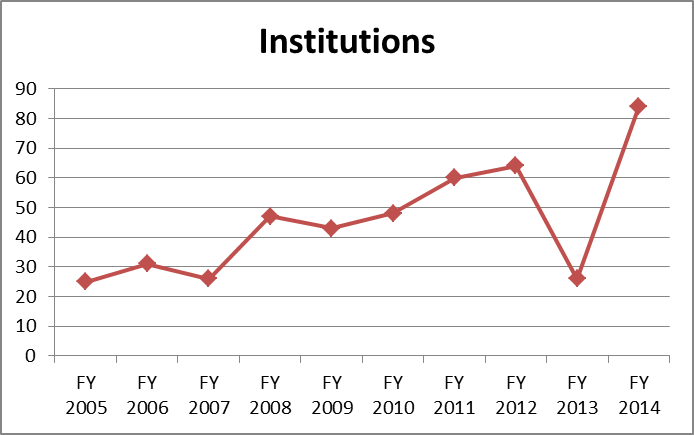
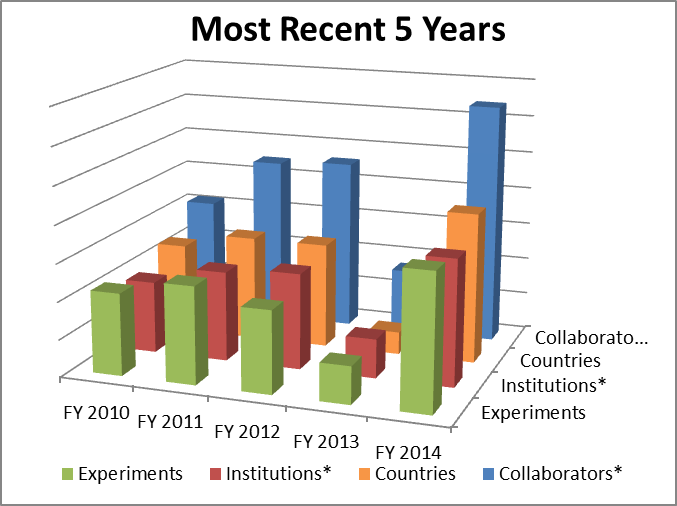
*Number of Collaborators and Institutions have been scaled to fit on the plot.